
eCommerce
Retail | Data Integration Strategy and BI Solution for Retail Giant
A major FMCG retail brand with over 120 supermarket outlets struggled with data scattered across sales, logistics, warehouses, inventory, and employee systems. Innovatics built an Azure-based integration pipeline and Power BI dashboards that unified all data sources, enabled near real-time visibility, and accelerated decision-making across operations, cost optimization, and revenue growth.
Outcomes
The Impact
A unified data foundation translated directly into operational gains, sharper inventory control, and faster, smarter decision-making.
The Challenge
The client operated more than 120 supermarket outlets with data scattered across BIZOM, SAP, POS, warehouse, and employee systems, blocking any holistic view of the business. Syncing BIZOM and SAP posed major technical hurdles due to differing data structures, while direct API calls were degrading BI report performance. Near real-time updates were essential for agile retail decisions, yet the team also had to balance comprehensive integration with cost optimization in Azure Data Factory. Add complex data mapping, parallel dashboard development, and automation needs, and the path forward demanded a robust, scalable solution.
Our Solution
Innovatics designed an Azure-based integration pipeline that seamlessly moved primary orders from BIZOM to SAP and primary invoices from SAP to BIZOM, powered by Azure Data Factory and Azure SQL Database. Over 40 specialized pipelines were developed for targeted data retrieval, supported by detailed dimensional modeling for comprehensive reporting. A 30-minute extraction schedule delivered near real-time updates, while a robust logging mechanism enabled quick issue resolution. Close collaboration with BIZOM and SAP teams ensured clean data mappings, and Power BI dashboards layered actionable insights on top of the unified foundation.
Technology Stack and Software
What We Used
A highly agile tech stack that enables quicker resolution
Data integration
Processing
Visualization
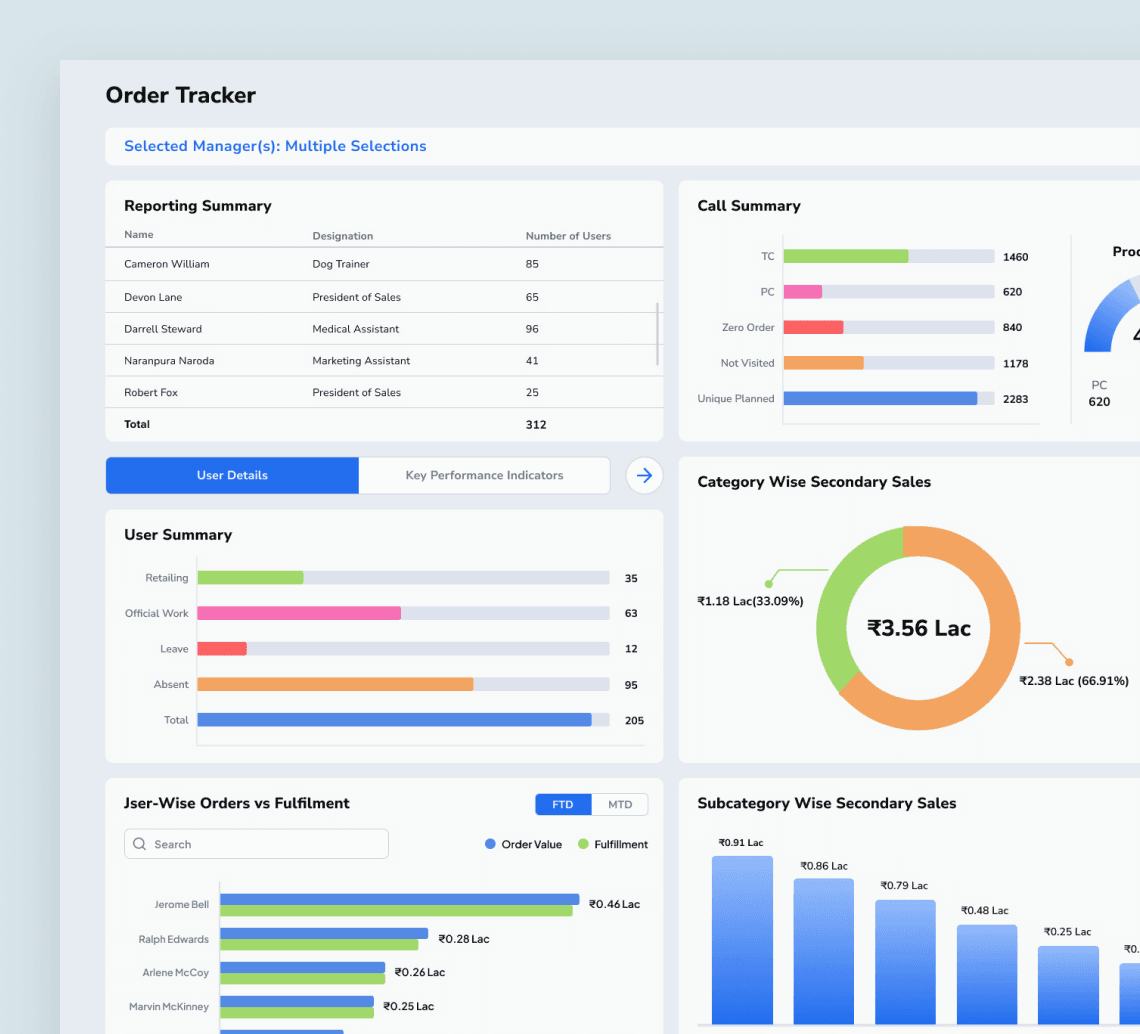
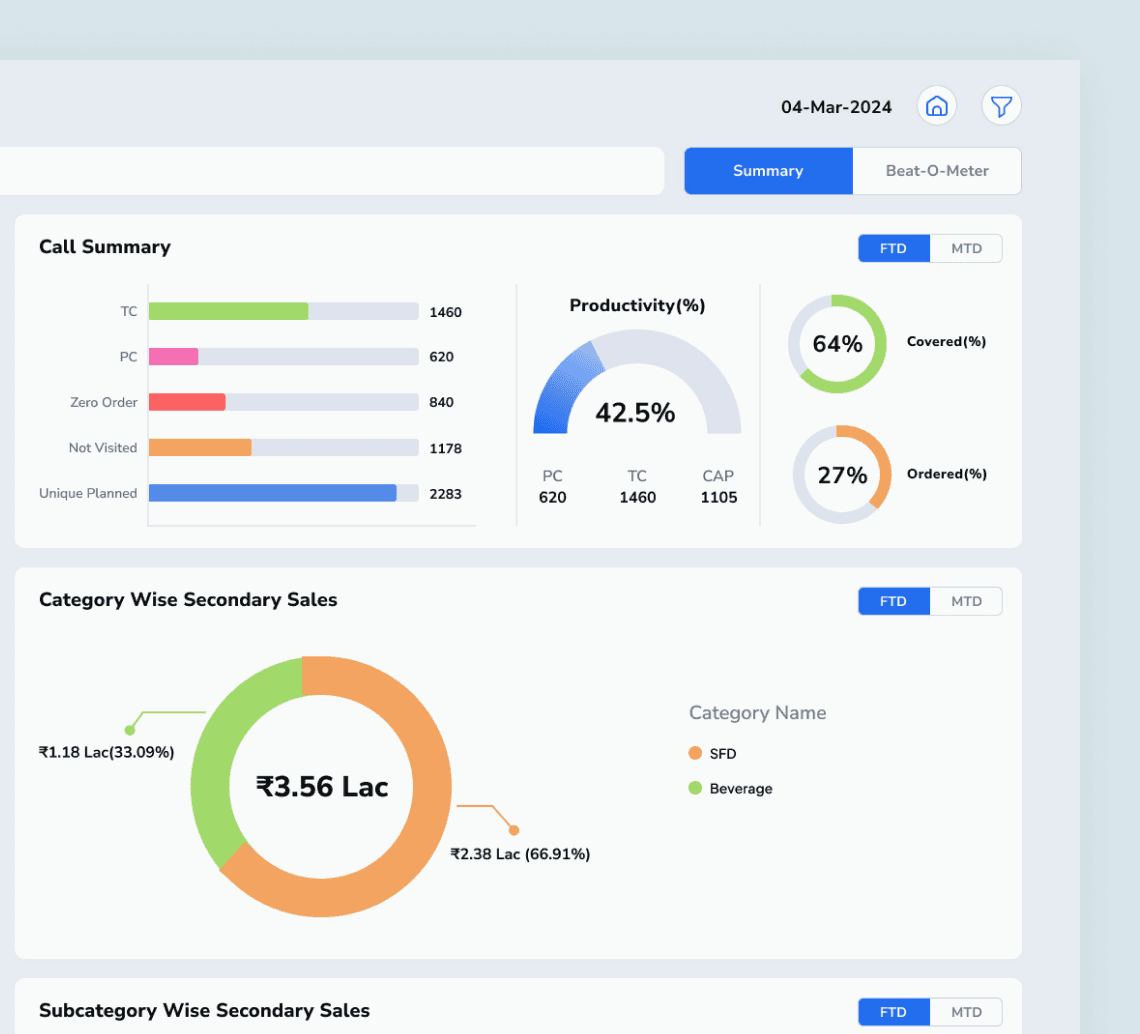
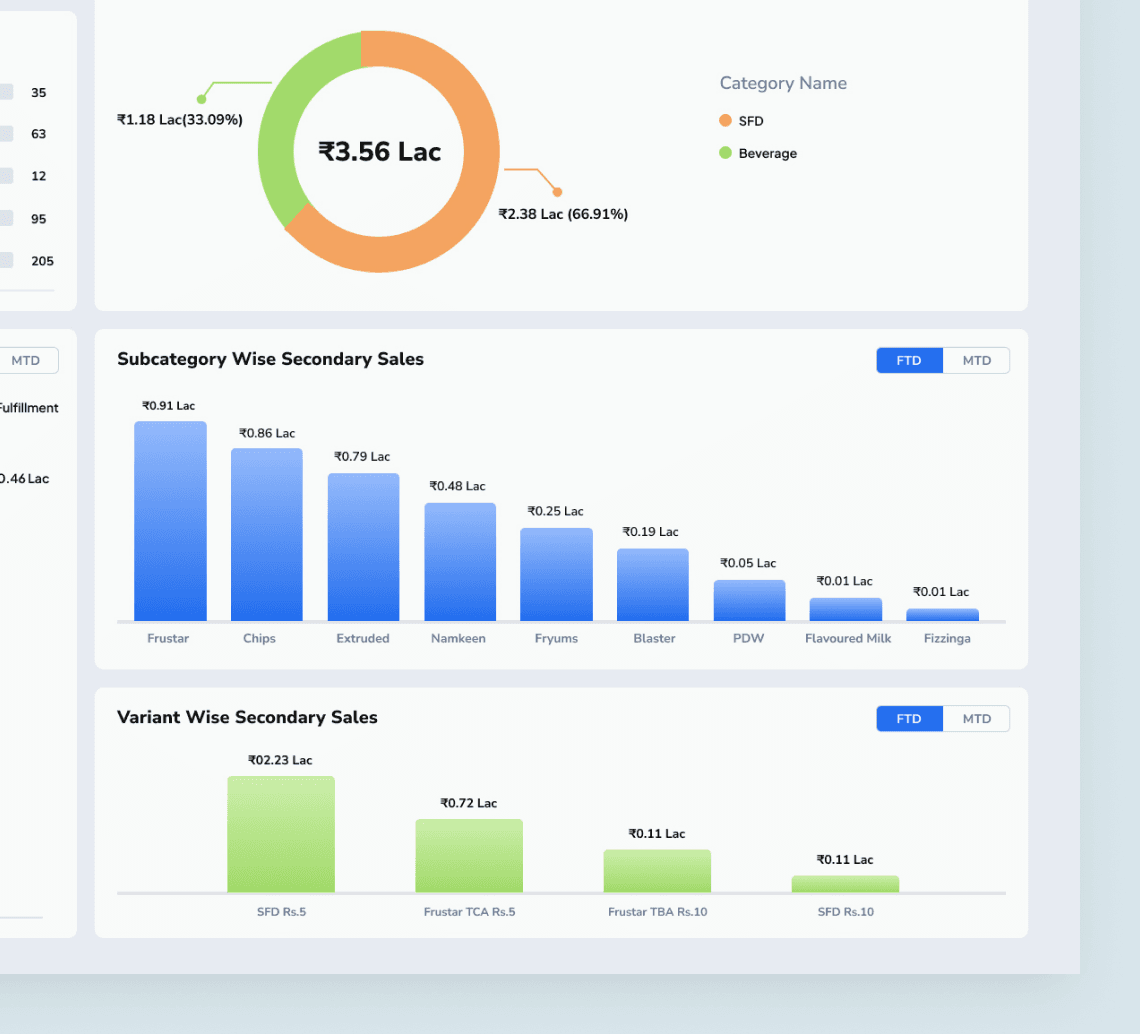
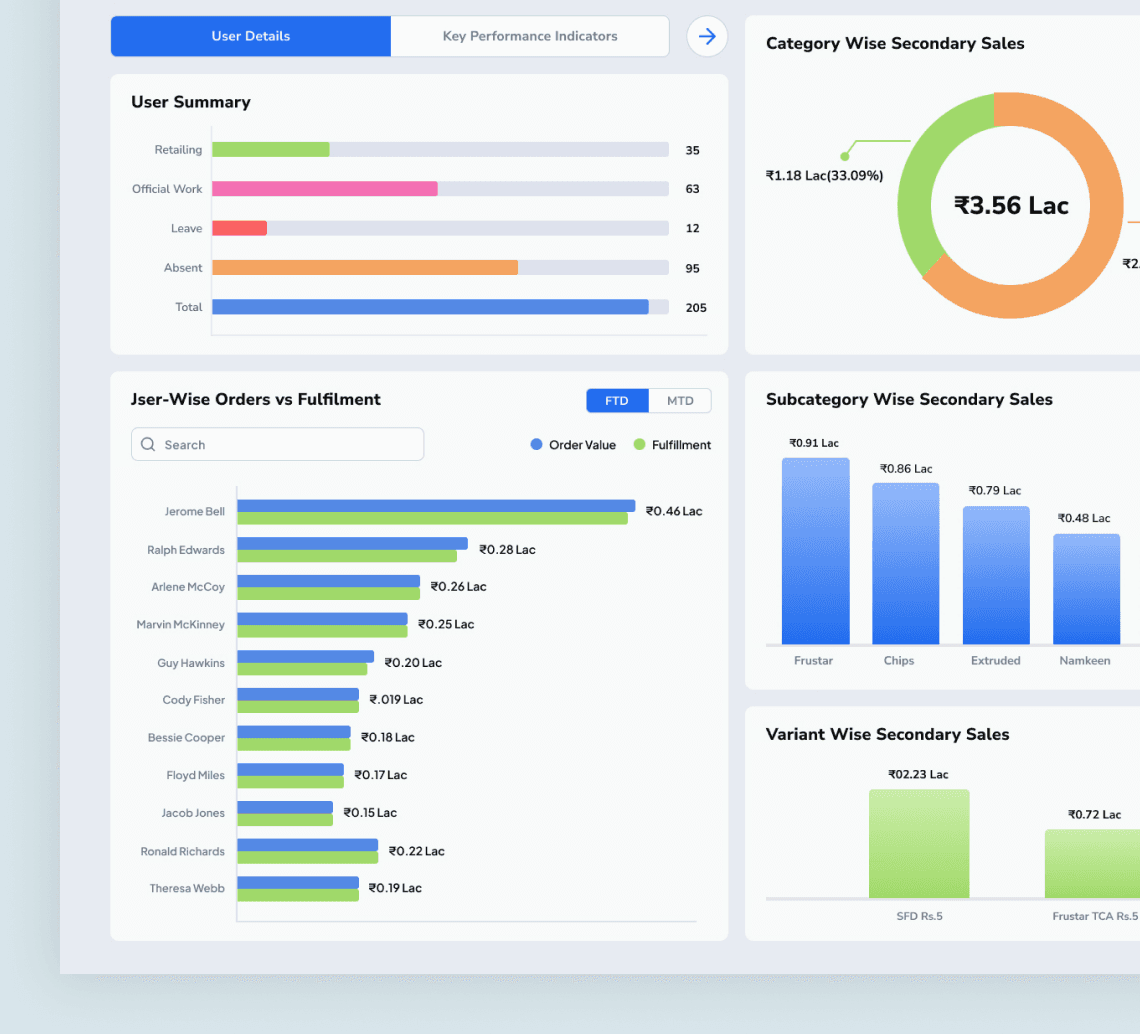
The Dashboard in Action
The Power BI dashboard suite gives the client a unified command center across retail operations. Order Tracker views surface reporting summaries, call summaries, productivity ratios, and coverage metrics in real time, while user-level analytics highlight individual performance, attendance, and sales activity. Category, subcategory, and variant-wise sales visualizations help merchandising, and category teams identify top performers and optimize the product mix. Order versus fulfillment comparisons expose bottlenecks instantly, empowering managers to act on issues the moment they emerge and keep every outlet running at peak efficiency.
The deeper return
Innovatics transformed fragmented retail systems into a unified data and BI engine that drives faster decisions, sharper operations, and sustained competitive advantage.
More cases
Other engagements worth your time.
Customer Intelligence
eCommerce | An eCommerce brand replaced gut-feel category decisions with a real-time market signal engine
Attribution Intelligence
eCommerce | eCommerce Brand Uses Affiliate Performance Dashboards to Boost Sales and Optimize Marketing Strategies
Talk to us
Working on a similar decision-execution gap?
If something here landed — the kind of signal you wish your team had, the cadence you wish you ran — talk to a senior team member. No pitch deck. Just a discussion about what you're trying to figure out, build, or change.