
Commercial Analytics · Business Intelligence
A three-step framework to identify brand opportunity pockets across the German market
A three-step framework to identify brand opportunity pockets across the German market An oncology brand needed to know where to focus field investment across Germany. Innovatics unified patient, hospital, and sales data into Power BI, built a five-factor hospital potential score, and overlaid brand indexing to reveal opportunity pockets, producing a twelve-cell action matrix guiding where to protect, win, and deprioritize.

Outcome
From Fragmented Data to Prioritized Field Action
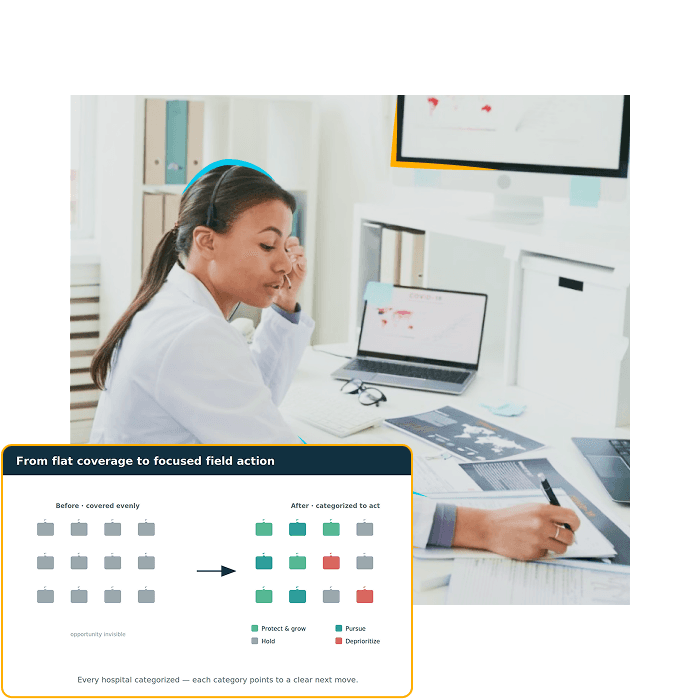
A unified analytical framework replaced broad territory coverage with account-level prioritization, showing exactly where brand headroom and untapped potential intersect.
The Challenge
The Challenge
Identifying where to invest commercially in a rare indication is difficult when patient activity, institutional infrastructure, and sales performance live in separate datasets at different levels of geographic granularity. Hospital and patient data, commercial sales figures, and invoice records could not be compared directly, leaving no reliable way to link sales performance to hospital catchment areas or postal code territories. Without a consistent measure of account potential, field resources risked being spread evenly rather than concentrated where opportunity was greatest. The team needed a defensible, repeatable method to separate genuine brand headroom from accounts already saturated or structurally low value.

Our Solution
Our Solution
Innovatics built a three-step framework. First, datasets were standardized and cleaned to enable brick-level mapping and linkage to postal codes, then integrated in Power BI with defined relationships and dynamic dashboards for ongoing analysis. Second, a five-factor scoring model quantified hospital potential on a 0 to 100 scale, weighting patient traffic at 50 percent, specialized outpatient care at 20, certified centers at 15, molecular diagnostics at 10, and clinical trial activity at 5, then segmented hospitals into High, Mid, and Low tiers. Third, both brands were indexed 0 to 100 on sales at the finest available geography and overlaid on potential scores to surface opportunity pockets.
Technology Stack
What We Used
Power BI for data integration, relationship modeling, and dynamic dashboards, drawing on hospital and patient data, commercial sales data, and invoice data linked at postal code level.
The Dashboard in Action
The Dashboard in Action
The Power BI environment gives commercial teams a unified view across patient activity, hospital footprint, and sales performance in one place. Users can track brand trajectory year on year, validate market share against the competitor, and identify postal code level conversion trends. Geographic opportunity mapping works at both postal code and macro ID level, linking sales directly to hospital catchment areas. Composite potential scores and brand indices combine into a twelve-cell matrix that classifies every account, from prime stronghold and white space through contested ground and ceded territory, each carrying a specific engagement play so field teams know exactly where to concentrate effort.

Closing Statement
Innovatics turned three disconnected datasets into a scored, geographically mapped opportunity model that tells commercial teams precisely which accounts to protect, win, and let go.
From the engagement summary
More cases
Other engagements worth your time.
Talk to us
Working on something similar?
Talk to a senior team member — no pitch deck, just a discussion about what you're trying to figure out, build, or change.