
eCommerce and Fashion Retail
eCommerce | Market Intelligence: eCommerce Product Analytics Dashboard from Online Portal
A fashion eCommerce brand needed sharper visibility into what was trending across online shopping portals. Innovatics collected product and review data, built an interactive Power BI dashboard, and surfaced insights on colors, patterns, price ranges, and regional demand. The solution replaced guesswork with data-driven decisions, fueling revenue growth, and smarter inventory planning.
Outcomes
The Impact
Real-time market intelligence translated directly into stronger revenue, leaner inventory, and deeper customer loyalty across categories and regions.
The Challenge
The client struggled to identify which products were truly trending across eCommerce marketplaces, leaving teams uncertain about where to focus on higher revenue. Visibility into customer preferences such as color, pattern, material, and price was limited, while regional demand variations remained a blind spot. Without a unified, evidence-backed view of the market, planning, merchandising, and marketing decisions were being shaped by assumptions rather than data. The brand needed a smarter way to read the market, prioritize high-performing products, and align production and promotion with what shoppers actually wanted.
Our Solution
Innovatics built a market intelligence engine designed to replace assumptions with evidence. The top 50 reviews per product were collected from online shopping portals, with key attributes including category, color, pattern, price, location, and date extracted, cleaned, and structured for analysis. The data was integrated into an interactive Power BI dashboard featuring KPIs, trends, and category insights, along with dynamic filters for category, price, region, and design feature. The result is a clear view of trending products, optimal price ranges, regional demand patterns, and competitive performance across platforms.
Technology Stack
What We Used
Tech stack that’s enables faster decision-making
Data extraction, cleaning and structuring workflows
Interactive visualization and market intelligence reporting
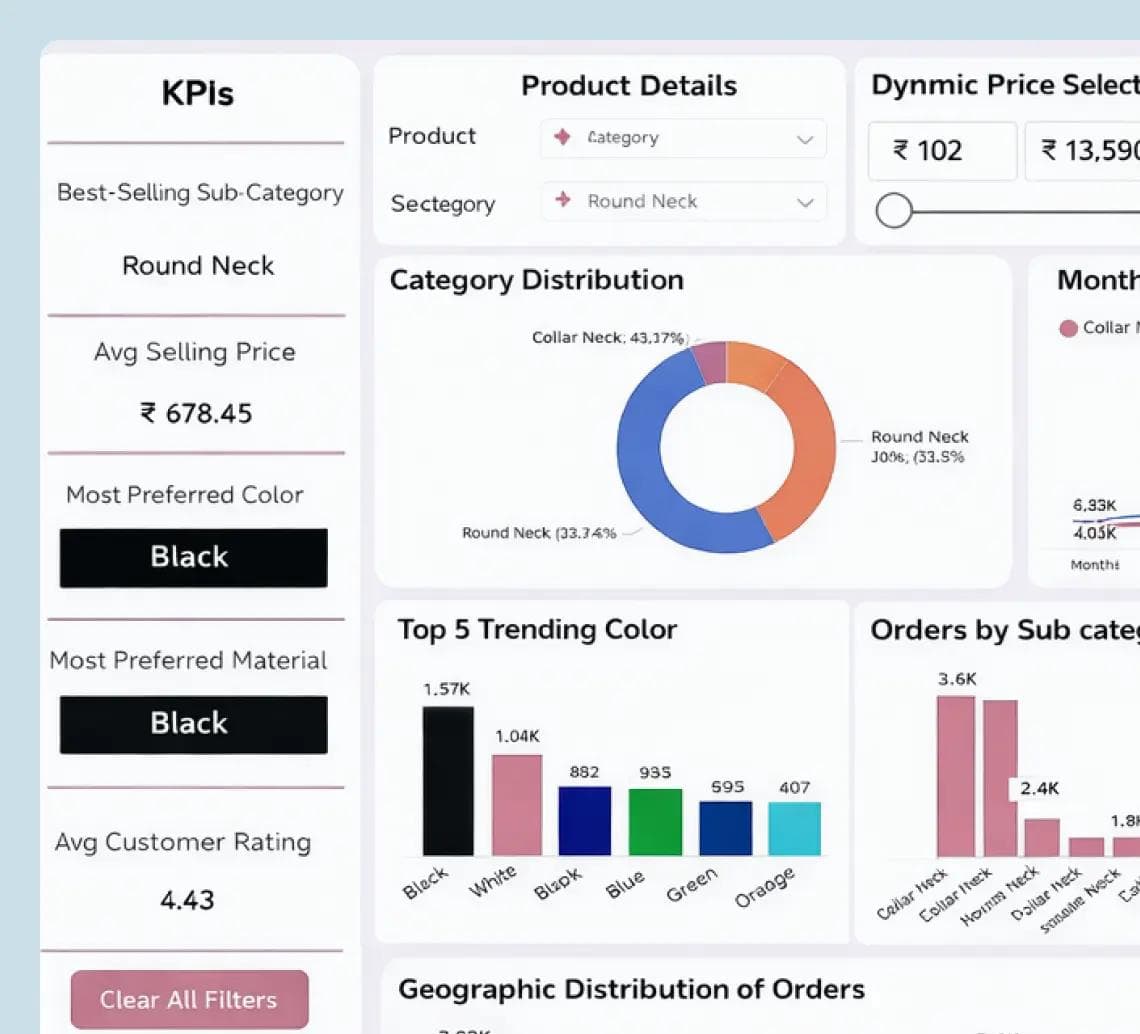
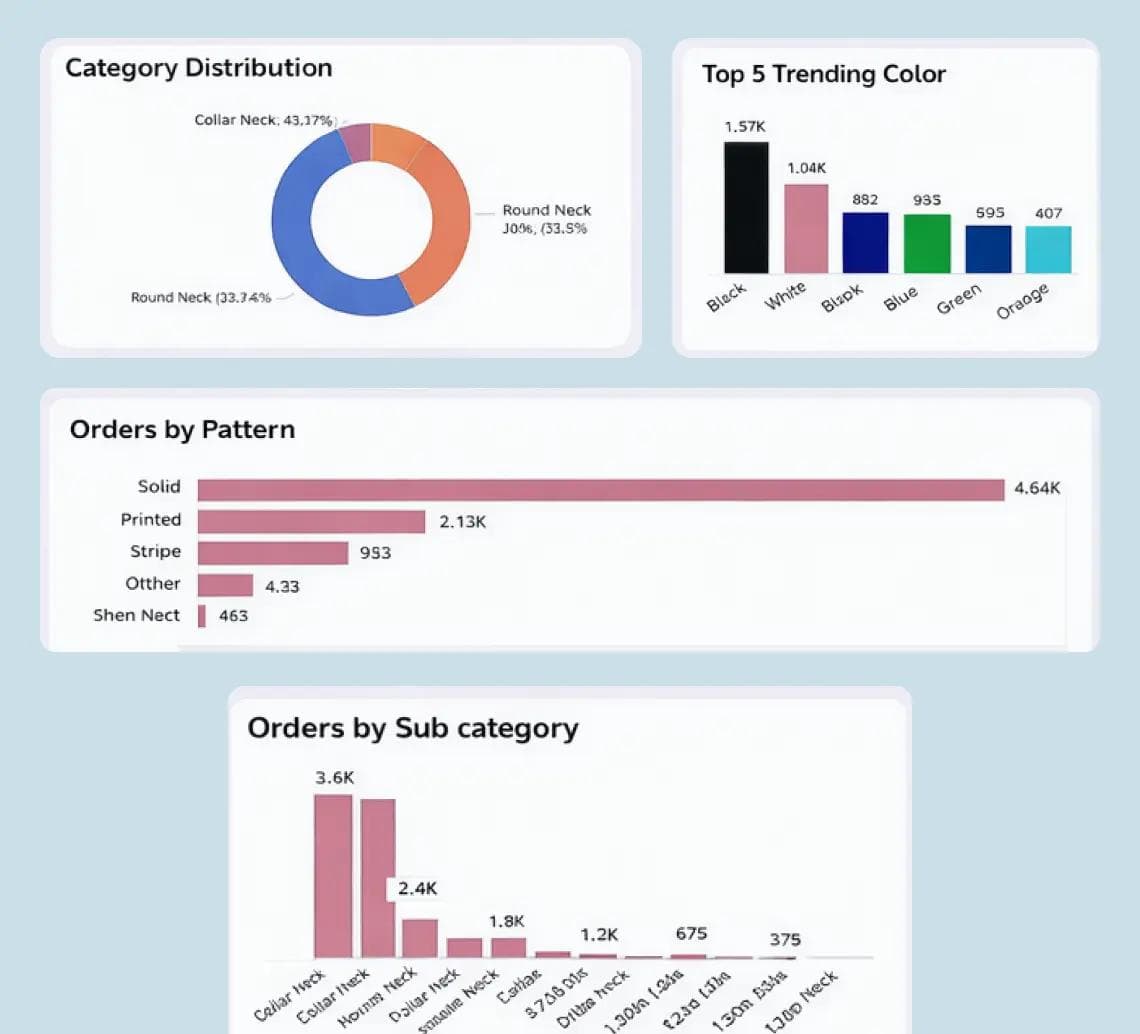
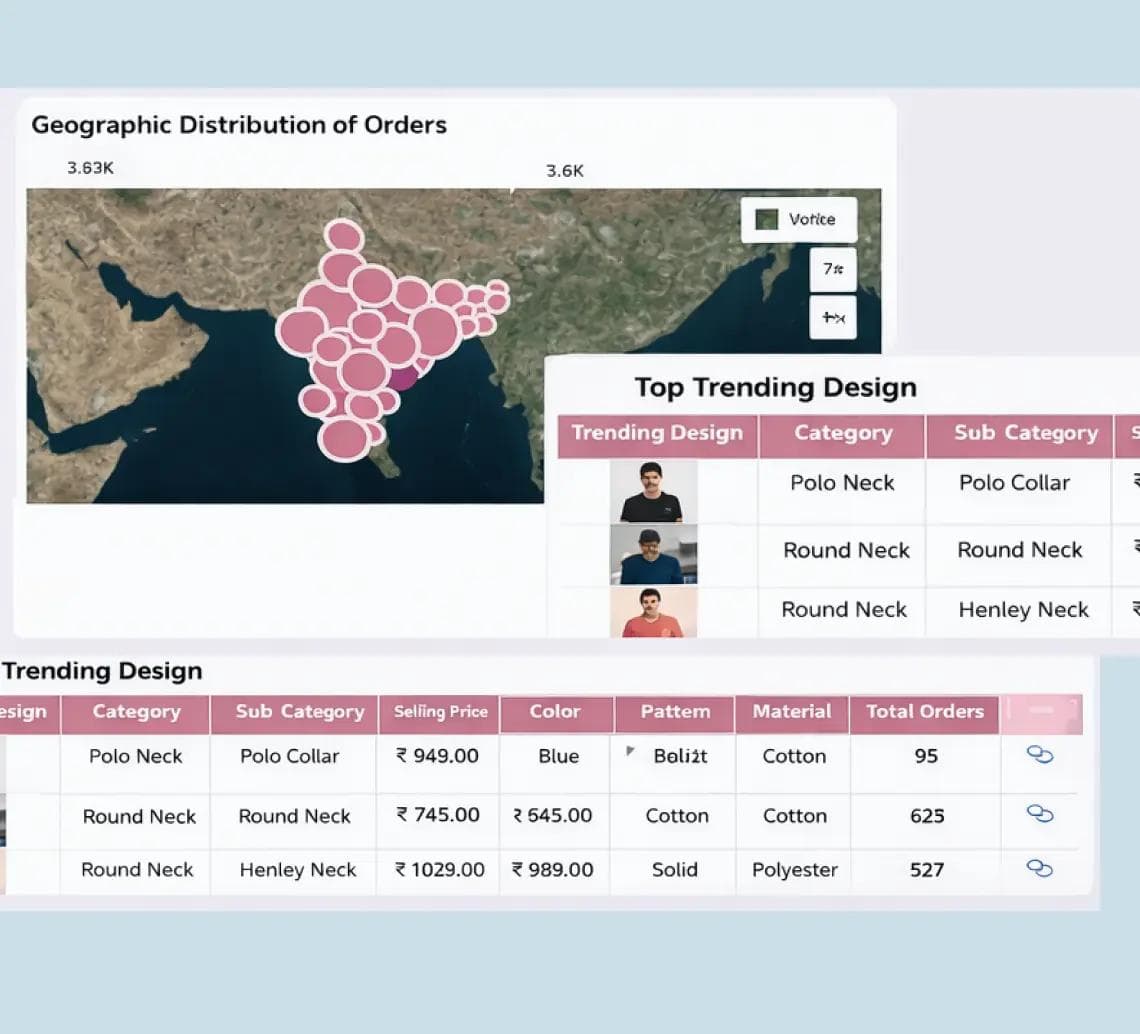
The Dashboard in Action
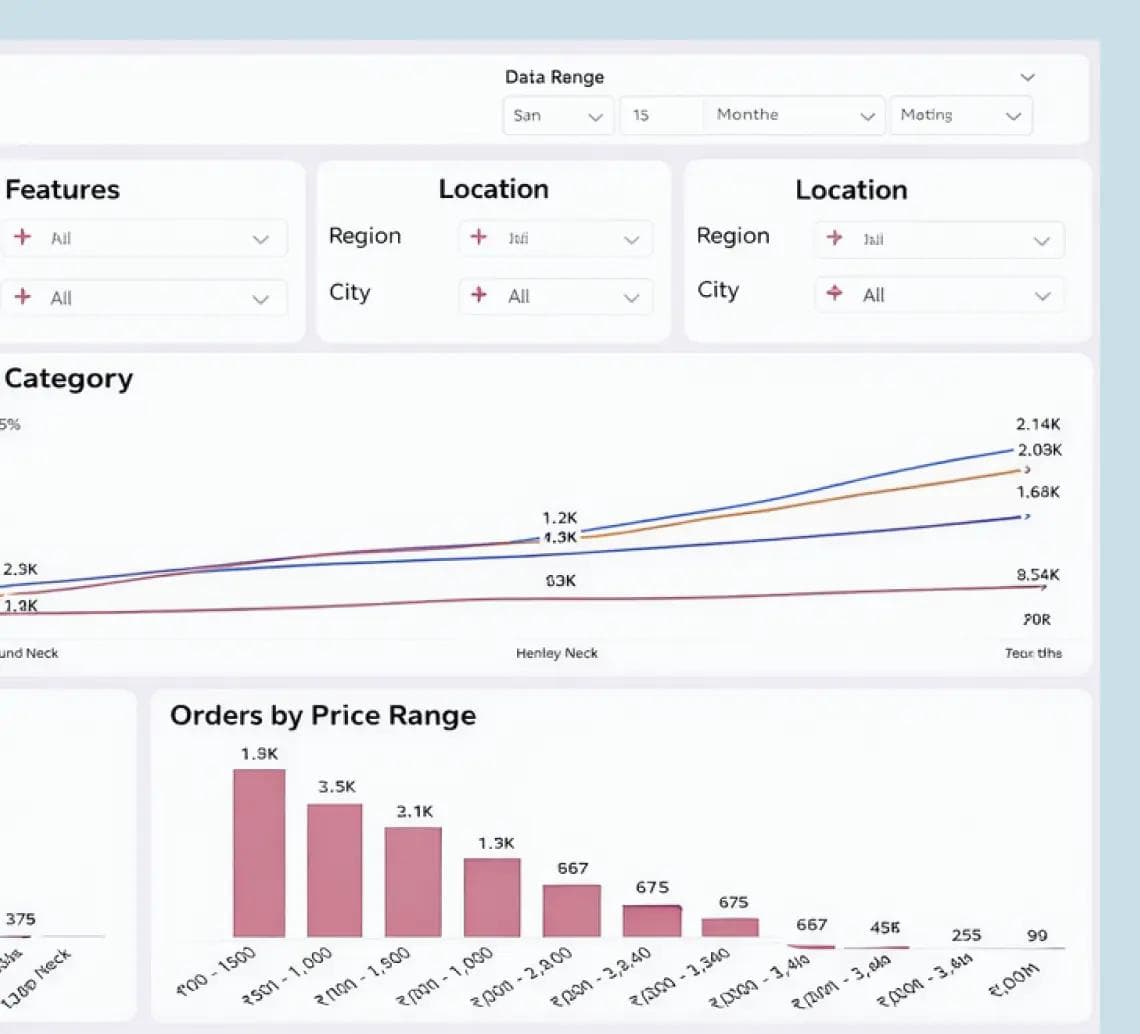
The Market Analysis dashboard gives the client a real-time command center for eCommerce intelligence. Business users can explore KPIs such as best-selling subcategory, average selling price, most preferred color and material, and average customer rating, then drill into category distribution, monthly order trends, top trending colors, orders by subcategory, and orders by price range. A geographic distribution map surfaces regional demand, while pattern and design insights guide merchandising. Dynamic filters across product, pattern, material, region, and city empower marketing, planning, and category teams to act on insights instantly.
The deeper return
Innovatics turned complex marketplace data into a live intelligence engine that drives sharper merchandising, smarter inventory, and measurable eCommerce growth.
More cases
Other engagements worth your time.
An eCommerce brand replaced gut-feel category decisions with a real-time market signal engine
Attribution Intelligence
eCommerce | eCommerce Brand Uses Affiliate Performance Dashboards to Boost Sales and Optimize Marketing Strategies
Talk to us
Working on a similar decision-execution gap?
If something here landed — the kind of signal you wish your team had, the cadence you wish you ran — talk to a senior team member. No pitch deck. Just a discussion about what you're trying to figure out, build, or change.