
Industrial IoT · Data Engineering
A rice manufacturer built plant-wide operational intelligence from noisy sensor telemetry.
A rice manufacturing giant needed to convert high-volume IoT sensor telemetry into operational intelligence. Innovatics built a complete Industrial IoT Data Platform spanning ingestion, CDC stabilization, dimensional modeling, and operational dashboards — eliminating resync disruptions, controlling BigQuery costs, and delivering unified plant-wide visibility across every processing stage.
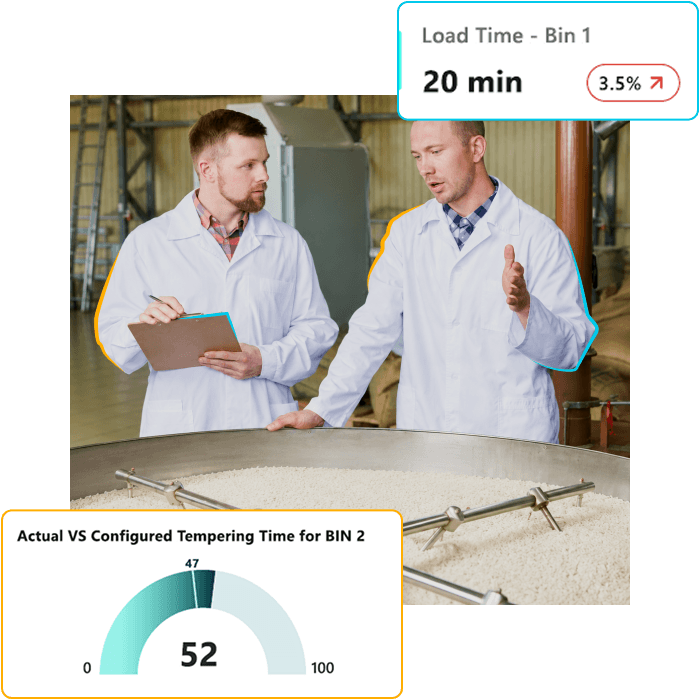
Outcomes
The Results
A resilient data platform turned raw telemetry into stable, cost-controlled operational intelligence across the entire rice processing plant.
The Challenge
What blocked progress.
The client operated a multi-stage rice processing plant generating high-volume IoT sensor data, but three issues blocked progress.
- CDC and schema-evolution instability triggered full historical replays into BigQuery — creating duplicate partitions, inflating egress and storage costs, breaking CDC window logic, and halting downstream pipelines.
- No unified operational visibility — no centralized plant-wide dashboard, only manual batch comparisons, no deviation-based monitoring, and no correlation between equipment downtime, sensor alerts, and production.
- High process variability compounded matters — temperature, moisture, and cycle times fluctuated across batches without any structured deviation tracking to bring them under control.
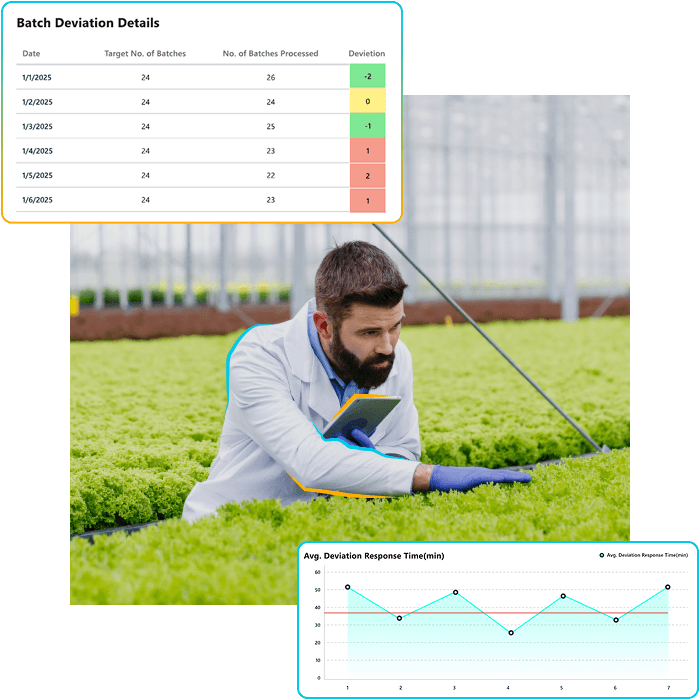
Our Solution
What we built.
Innovatics delivered a complete Industrial IoT Data Platform built on three pillars.
- A resilient CDC and ingestion framework — controlled schema evolution handling, prevented historical replay during new tag additions, eliminated duplicate partition creation, stabilized BigQuery cost spikes, and added ingestion validation and logging.
- Centralized data modeling — a batch-stage dimensional schema, structured time-series transformations, a deviation-based KPI framework, and linked sensor telemetry with equipment uptime.
- An operational intelligence layer — powering batch-performance analytics, stage-wise time and temperature monitoring, cross-tank and product benchmarking, downtime Pareto analysis, and critical alert correlation across the plant.
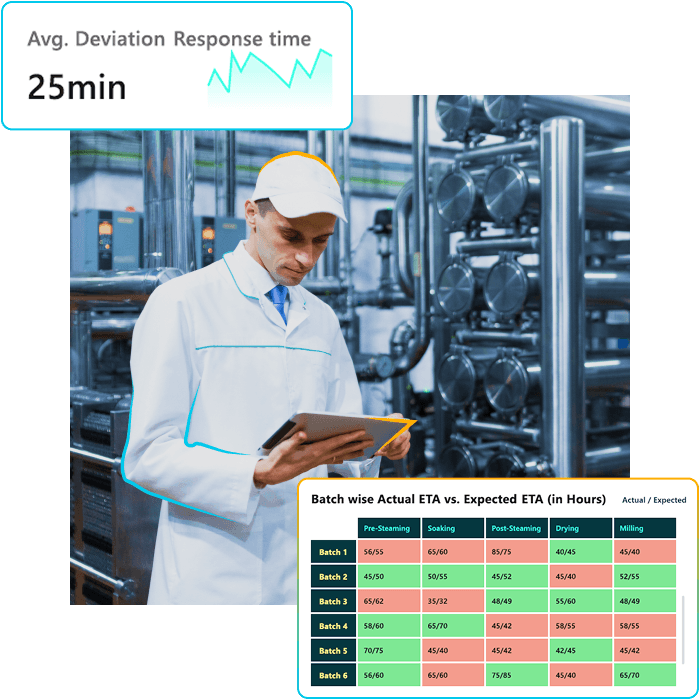
Technology stack
What we used.
Chosen to fit the client's operating environment and keep post-handover overhead low.
Ingestion
Storage
Modeling
Surfacing
The dashboard in action
How the team works now.
The dashboard suite gives the client unified, real-time visibility across the plant.
- Batch Intelligence Dashboard — tracks ongoing vs. completed batches, stage progress, and average deviations in time, temperature, and moisture with current vs. historical comparisons.
- Stage-Level Monitoring — pre-steaming temperature analysis, soaking and post-steaming time tracking, tank and product comparisons, and steam-starvation and valve performance.
- Equipment & Sensor Health Dashboard — overall uptime, downtime by section and equipment, downtime reason Pareto analysis, and critical alert logs — empowering operations teams to act on issues the moment they emerge.
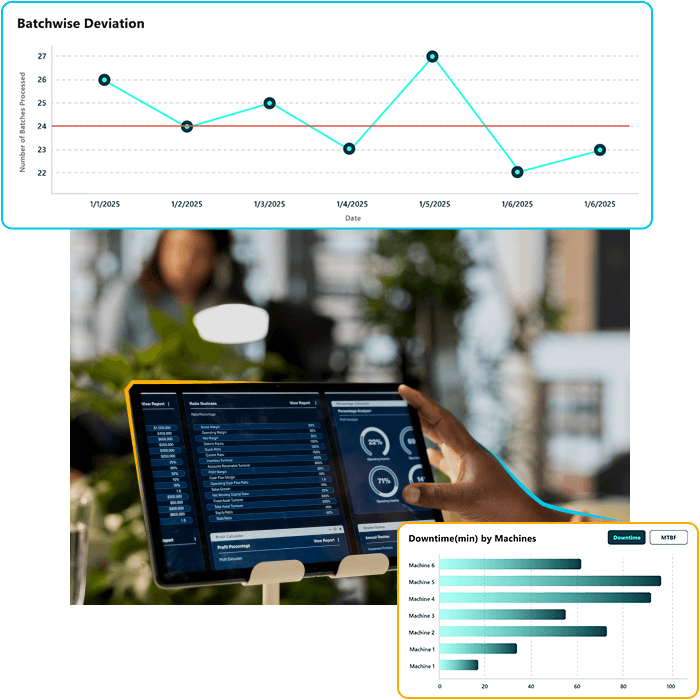
The deeper return
Innovatics turned high-volume sensor telemetry into a resilient, cost-controlled intelligence platform that drives plant-wide visibility and faster, sharper operational decisions.
From the engagement summary
More cases
Other engagements worth your time.
An eCommerce brand replaced gut-feel category decisions with a real-time market signal engine
Attribution Intelligence
eCommerce | eCommerce Brand Uses Affiliate Performance Dashboards to Boost Sales and Optimize Marketing Strategies
Talk to us
Working on a similar challenge?
If something here landed — the scale, the cadence, the problem shape — talk to a senior team member. No pitch deck. Just a discussion about what you're trying to figure out, build, or change.