


The $450 Problem You Can’t See
So, picture this: It’s Tuesday afternoon, 2:15 PM, and there are around 8 customers standing in your checkout line. Three of them glance at their watches, and looking at the queue ahead, they just abandoned their carts and walked out.
Your store just lost $450 in potential revenue. No alarms were sounded, your manager didn’t notice, nor did your point-of-sale system show anything because these transactions never happened. Next day’s sales report will show that Tuesday was “a bit slow,” but you’ll never know why.
This is retail’s visibility problem.
E-commerce companies track every click, every cart addition, every page where visitors exit, and they know precisely where their funnel breaks. But physical retail? You only see the transactions that completed, and everything that happens before checkout — browsing, hesitation, frustration, abandoned intent — remains a black box.
You’re operating blind in your own store.
This is the visibility gap that Vision AI closes, and not by magically preventing problems, but by making them impossible to ignore.
What Vision AI Actually Does (And Doesn’t Do)
Let’s get the hype out of the way first.
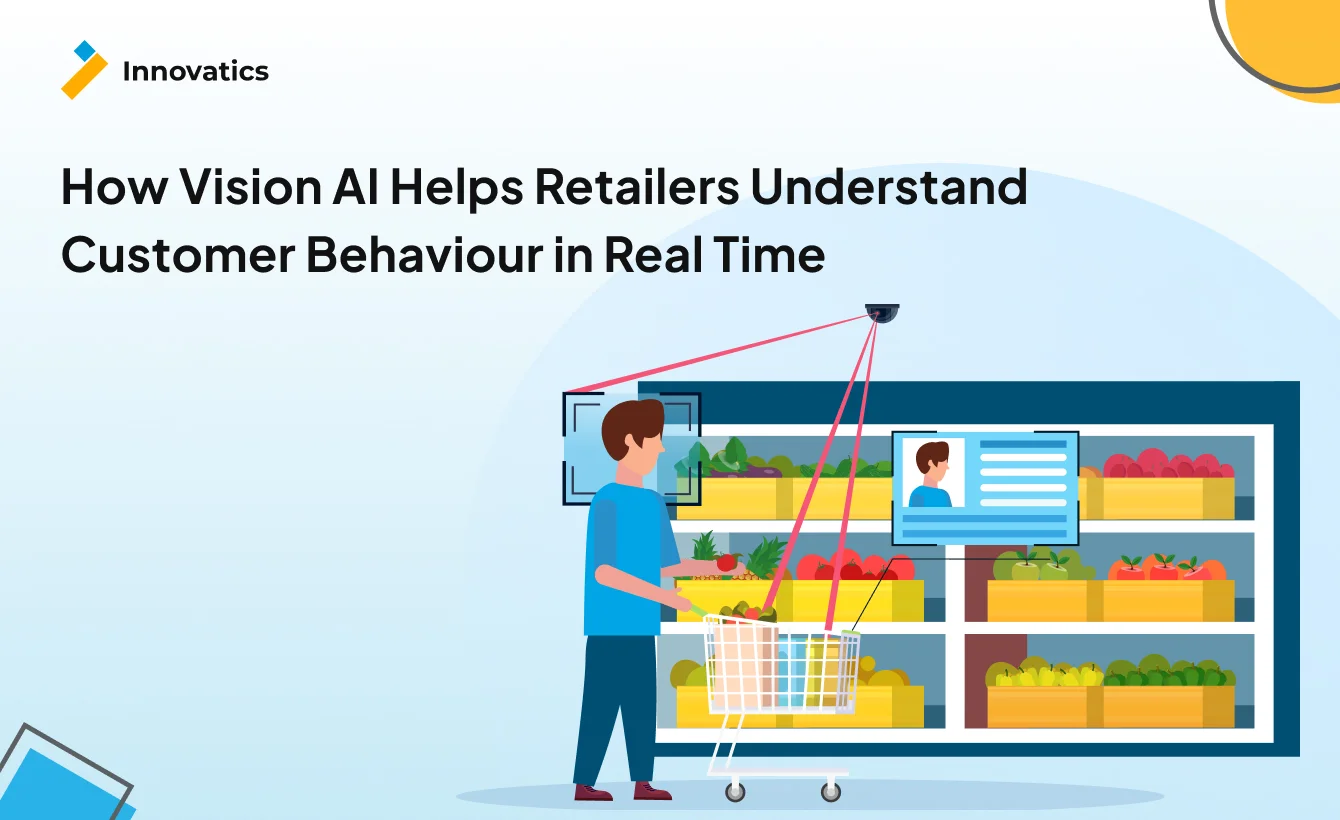
Vision AI is a diagnostic tool that turns your existing security cameras into behavioral sensors. It observes customer movement patterns, measures time spent in specific locations, identifies traffic flow patterns, and tracks queue formation in real time.
Here’s what it isn’t — some kind of magic sales booster. Vision AI won’t fix bad product placement, confusing store layouts, or undertrained staff, and it won’t automatically optimize your store. It shows you exactly where to optimize and leaves the strategic decisions to you.
The value proposition is straightforward, and according to industry analysis, stores deploying AI-powered video analytics report sales lifts between 3–5%. But the real value isn’t in boosting what’s working — it’s in preventing revenue loss from friction you never knew existed.
The technical reality: Most Vision AI systems use your existing CCTV infrastructure, which means no massive hardware overhaul. The technology tracks movement patterns anonymously — no facial recognition for behavior analysis — fully compliant with GDPR and CCPA regulations. It integrates with your point-of-sale systems, scheduling software, and inventory management platforms to create a complete operational picture.
Now, let’s talk about what this actually looks like in practice.
The Six Ways Vision AI Reveals Hidden Customer Behavior
1. Footfall Analytics & Peak-Hour Prediction
What it measures: Visitor count by hour, day, and week. Entry versus exit patterns. Conversion rate (visitors who actually become buyers).
Think of footfall analytics as your store’s vital signs monitor. Just as a hospital tracks heart rate and blood pressure continuously, footfall systems track the pulse of your retail operation.
The business impact centers on three areas. First, staffing optimization — retailers can track key performance indicators including conversion rate, visitor traffic count, staff scheduling, and shopper-to-staff ratio, with precision that gut instinct can’t match. Second, marketing attribution — you can finally answer whether that weekend Instagram campaign actually drove foot traffic or just generated vanity metrics. Third, lease negotiations — hard traffic data gives you leverage with landlords when discussing rent terms.
Here’s a real-world scenario: A coffee shop discovers that on Tuesday afternoons between 2–3 PM, they have 40% higher traffic than anticipated. Staff scheduling was built with the assumption that mid-afternoons are slow. The data reveals otherwise.
Action: shift one barista from the actual slow 11 AM–12 PM slot to the hidden peak at 2 PM.
Result: Reduced wait times during the actual rush, prevented customer walkouts, and no additional labor cost.
We’ve deployed footfall analytics for restaurant chains where hour-by-hour traffic patterns revealed service bottlenecks during non-traditional peak times — times that experience and intuition would miss entirely. The data doesn’t lie, even when it contradicts your assumptions.
2. Dwell-Time Analysis Near Displays & Sections
What it measures: Average time spent in specific zones across the store, which displays generate lingering attention versus quick glances. High-engagement versus low-engagement product areas.
Dwell time is the retail metric that most people ignore, which they shouldn’t. Research shows that dwell time correlates more closely with conversion than raw footfall, meaning the time someone spends considering a product matters more than whether they walked past it.
The data that matters breaks down like this:
- 20 seconds of dwell time indicates browsing.
- 60+ seconds suggests serious consideration.
- Less than 5 seconds means your display failed to engage entirely.
Here’s the business impact: Dwell time analysis drives merchandising intelligence, promotional effectiveness measurement, and product placement ROI. If you’re paying premium rent for end-cap displays or promotional space, dwell time tells you whether that investment is working.
Real-world application: An electronics store sees 90-second average dwell time at the laptop display but only 15 seconds at the accessories wall.
Initial assumption: Customers aren’t interested in accessories. But sales data shows they are buying accessories — just not many.
The insight: Customers want accessories but can’t find them easily. The accessories wall has poor sightlines from the main traffic flow.
Action: Move accessories adjacent to the laptop display.
Result: Accessories sales increased 18% without changing a single product or price point.
Dwell time tells you what customers want to buy but can’t figure out how. It’s the difference between “not interested” and “interested but confused.” That distinction is worth millions.
3. Customer Journey Mapping (Entry → Navigation → Checkout)
What it measures: The most common paths customers take through your store. “Spaghetti diagram” visualizations of movement patterns. Entry-to-checkout time distribution. Dead zones — areas customers are actively avoiding.
Customer journey mapping answers questions you didn’t know to ask, such as: ‘Why do 60% of customers never see your west-side displays?’ ‘Why does the average shopping trip take 23 minutes when your store layout should require only 15?’ and ‘Why do customers cluster near certain fixtures and ghost others?’
The business impact is substantial. Research indicates that mapping shopper journeys allows retailers to identify pain points in the customer experience, such as bottlenecks or consistently crowded areas. This translates to layout optimization, product adjacency strategy, and dead zone revival.
Consider the hidden cost of poorly designed journeys. As industry analysis notes, customers spend an average of 20 minutes in a store, meaning every minute in a waiting line converts to one minute less to make a potential purchase.
Real-world application: A grocery store discovers that 60% of customers skip the west aisle entirely. The investigation reveals the aisle has poor sightlines from the main corridor — customers don’t even know it exists.
Action: Install directional signage at the corridor entrance and relocate a popular item to that aisle to drive traffic.
Result: Traffic to the west aisle increases 35%, storewide dwell time increases 12%, and adjacent product sales increase significantly.
Journey mapping doesn’t just show where customers go — it shows where they don’t go, and more importantly, why. That’s where the revenue opportunity hides.
4. Heatmaps for Product Engagement
What it measures: Visual representation of traffic intensity using color coding (red zones indicate high traffic, blue zones indicate low traffic). Hot zones versus cold zones. Engagement clustering around specific fixtures.
Heatmaps are the retail equivalent of thermal imaging. They reveal patterns invisible to the human eye, even to experienced store managers who think they know their space intimately.
The business impact centers on premium positioning. Predictive footfall analysis identifies high-traffic zones within the store, enabling strategic placement of premium products to maximize visibility and sales potential. Heatmaps also drive marketing spend efficiency — place digital displays where eyes actually land, not where you assume they do — and enable A/B testing of store layouts with measurable, immediate impact assessment.
The power of visual data: heatmaps answer the question “If I move this display six feet to the left, will anyone notice?” Unlike sales data (a lagging indicator that tells you what happened last week), heatmaps are leading indicators that predict what will happen when you make changes.
Real-world application: A department store has prime floor space at the store entrance and uses it for seasonal promotions.
The assumption: Everyone sees it because it’s positioned right at the door.
The heatmap reality: 70% of customers enter and immediately veer right, following the natural traffic flow toward the escalators. They bypass the entrance display entirely.
Action: Move seasonal promotions to the natural traffic flow path on the right side of the entrance.
Result: Promotional engagement increases 40%, conversion on promoted items increases 28%.
Heatmaps are retail’s “trust but verify” mechanism. Your intuition says customers notice that display. The data shows they walk right past it. Data wins.
5. Queue Length & Checkout Optimization
What it measures: Real-time queue count, average wait time by hour, queue abandonment triggers, and cashier utilization rate.
Queue management might be Vision AI’s highest-ROI application because the thresholds are so well-documented. Research shows that 7 people queuing up is the tipping point and most shoppers won’t bother joining. Further analysis indicates that 75% of lost sales are caused by wait times, with queues approaching this critical 7-person threshold.
The long-term damage is even worse. As per industry research, 70% of customers are less likely to return to a store if they experience long queues on at least one occasion. You’re not just losing today’s sale — you’re losing customer lifetime value.
The hidden ROI of queue management includes preventing immediate cart abandonment, preventing customer churn and associated lifetime value loss, and optimizing labor costs by reducing overstaffing during genuinely slow periods.
How it works in practice: The system detects 6 people in the checkout queue, and an alert is sent to the floor manager: “Approaching abandonment threshold.” The manager opens an additional register within 90 seconds. The queue drains before reaching the critical 7-person mark. Crisis averted, and revenue protected.
Real-world application: A grocery store experiences a 3 PM rush coinciding with school pickup time.
The old way: Reactively open lanes after queues have already formed and frustrated customers.
The new way: Predictive alerts at 2:50 PM based on historical traffic patterns.
Action: Proactively staff checkout before the rush hits.
Result: Wait times maintained under the 14-minute abandonment threshold, cart abandonment down 60%, customer satisfaction scores up 22%.
Queue management isn’t about eliminating lines — that’s impossible during peak times. It’s about keeping queues below the psychological breaking point where customers mentally check out.
6. Identifying Bottlenecks That Cause Lost Sales
What it measures: Congestion points where traffic slows or stops. Aisle width versus traffic volume mismatches. Service desk wait times. Staff-to-customer ratios in high-engagement zones.
Bottleneck identification reveals the most expensive operational failures — the ones that happen in aisles and product sections, not just at checkout.
Consider this documented finding: When there are 7 or more customers per associate in the shoe section, shoe conversion drops significantly. A store can have adequate overall staffing but completely inadequate coverage in high-consideration purchase areas. Customers want help. No one’s available. Sale lost.
The bottleneck-to-lost-sale chain works like this: Customer wants help in the electronics section, and no staff are available because everyone’s covering checkout. The customer waits three minutes — then gives up and leaves.
The result: lost sale, negative brand perception, potential social media complaint, and you never even knew it happened.
Real-world application: A sporting goods store sees consistent traffic jams at the equipment section on Saturday mornings. Root cause analysis reveals the aisle is too narrow for weekend customer flow when people are pushing shopping carts.
Action: Widen the aisle by moving one fixture and rerouting traffic flow slightly.
Result: Congestion eliminated, time-in-section increases 20% (more browsing), conversion increases 15%.
The most expensive bottlenecks aren’t at checkout — they’re in the aisles where customers want to buy but can’t get help, can’t navigate comfortably, or can’t even engage with products because of crowding.
What This Means for Your Operations
Vision AI fundamentally shifts retail operations from reactive to predictive.
The old way: “Sales were down yesterday — then wonder why?” You investigate after the fact. Was it traffic? Weather? A competitor’s promotion? You’ll never really know.
The new way: “System predicts a 30% traffic spike this Saturday between 2–4 PM based on historical patterns and local event schedules. Staff accordingly.” You prevent problems before they happen.
This shift from gut instinct to data truth matters enormously. Your floor manager thinks the seasonal display is working well — lots of people walk past it. The heatmap shows 80% of customers walk past it without stopping. Engagement is actually terrible. Data wins. Display gets moved. Sales improve.
The operational shift also moves from manual observation to automated alerts. A manager can’t simultaneously watch 12 checkout lanes, monitor the entrance for traffic spikes, and keep eyes on the floor for customer-staff interaction gaps. AI can — and it notifies exactly when and where intervention is needed.
Integration reality: Vision AI systems work with existing CCTV infrastructure, which means 85% of retailers already have the necessary cameras installed.
Typical deployment timeline: 2–4 weeks for a single-location pilot. Fleet-wide rollout: 3–6 months, depending on store count and organizational complexity. Requirements include network connectivity, staff training on the alert system, and workflow changes to ensure alerts actually trigger actions. The technology is the easy part. Organizational change management is harder.
Privacy and compliance: Modern systems use anonymous tracking — no facial recognition — for behavior analysis. They’re GDPR and CCPA compliant, working with aggregate data rather than storing personally identifiable information. Many systems process data on-site using edge computing rather than transmitting video feeds to the cloud, addressing both privacy and bandwidth concerns.
The investment question: Implementation costs for queue management and behavior analytics systems typically range from $25,000 to $150,000 depending on scale, feature set, and integration complexity. Industry data shows that retailers report ROI within 12–18 months of implementation, driven by cost savings and revenue growth.
Calculate your specific ROI: Average cart value × cart abandonment rate × daily traffic = daily revenue at risk. If you’re losing even 5% of potential sales to queue abandonment and bottlenecks, the math becomes compelling quickly.
When Vision AI Isn’t the Answer
Let’s be honest about when this technology doesn’t make sense. Innovatics doesn’t sell solutions that won’t work.
Skip Vision AI if your store layout is fundamentally broken.
Vision AI will show you the problem faster and with more precision, but it won’t fix it. If customers avoid entire sections because your layout is confusing, contradictory, or illogical, fix the layout first. Technology can’t overcome poor merchandising strategy.
Skip it if you have no process to act on insights.
Data without action equals an expensive dashboard that no one uses. You need manager empowerment to open lanes, move fixtures, and adjust staffing in response to what the data reveals. If your organization is too rigid to change based on data — if every fixture move requires three approval layers and a committee meeting — then wait until your organization evolves. The technology will still be here.
Skip it if your traffic volume doesn’t justify the investment.
A small boutique with 50 customers per day probably won’t see ROI on a $50,000 system. High-volume locations with 500+ daily visitors see much faster payback. Do the math for your specific situation.
Skip it if you haven’t solved basic operational issues.
If your checkout is slow because your POS system crashes three times per day, fix that first. If customers abandon carts because your staff doesn’t know product details, train your staff. Vision AI reveals problems — it assumes you’re capable of solving them once revealed.
We’ve turned down projects where clients expected Vision AI to magically fix sales. It won’t. It will show you exactly why sales are broken — but only if you’re ready to do something about what you learn.
How Innovatics Approaches Retail Behavior Analytics
Our methodology starts with auditing your current blind spots. What questions can’t you answer today? Where do you think customers experience friction versus where they actually do? The gap between assumption and reality is usually enormous.
We pilot in your highest-ROI location. We don’t start with fleet-wide rollout. We identify the store with the highest traffic, most customer complaints, or biggest revenue variance and prove value in 90 days. If it works there, we scale. If it doesn’t, we figure out why before expanding.
Our tech stack uses OpenCV and Azure Custom Vision — vendor-agnostic solutions that integrate with your existing systems. We connect to your POS, scheduling software, and inventory management without proprietary lock-in. You own your data. You control your infrastructure.
Our focus is staff enablement, not replacement. Alerts empower floor managers to take action. We train teams to interpret data, take action, and measure impact. The best outcomes combine human judgment with AI insights — not one or the other.
Our proof: We deployed footfall and heatmap analytics for a restaurant chain client. The system identified a bottleneck at the drive-through menu board — customers couldn’t read menu items from 15 feet away, causing order delays and confusion. Action: repositioned the board closer to the ordering point and simplified the menu layout. Result: order completion time decreased 22%, customer satisfaction scores increased 18%, drive-through revenue increased 12% without any menu price changes.
Vision AI won’t fix every problem. But it makes damn sure you can’t ignore the ones costing you revenue.
See What You’re Missing
Your store isn’t lacking customers — it’s lacking visibility into why customers leave without buying.
Industry research shows that retailers deploying shelf-monitoring computer vision have seen out-of-stock events reduced significantly, and computer vision queue analytics can cut wait times during peak periods. Further analysis indicates that retailers using computer vision for customer experience optimization report improvements in customer satisfaction scores, with some seeing increases of 15–25%.
The question isn’t “Should we invest in Vision AI?” The question is “Can we afford not to know what’s happening in our stores?”
E-commerce retailers optimize every pixel, every page loading time, every button placement. They know exactly where their funnel breaks and fix it immediately. You have the advantage of physical presence, personal service, and tangible products that customers can touch and experience. Vision AI simply levels the playing field on data intelligence.
The stores that win in 2026 and beyond will be the ones that see and act on what others miss.
Want to understand what’s really happening in your retail locations? Innovatics helps retailers deploy Vision AI solutions that reveal customer behavior patterns, identify revenue-killing bottlenecks, and enable data-driven operational decisions. Our approach combines proven technology with honest implementation guidance — because the best solution is the one that actually works for your specific situation.
Contact us to discuss how behavior analytics could transform your retail operations.


Neil Taylor
April 8, 2026Meet Neil Taylor, a seasoned tech expert with a profound understanding of Artificial Intelligence (AI), Machine Learning (ML), and Data Analytics. With extensive domain expertise, Neil Taylor has established themselves as a thought leader in the ever-evolving landscape of technology. Their insightful blog posts delve into the intricacies of AI, ML, and Data Analytics, offering valuable insights and practical guidance to readers navigating these complex domains.
Drawing from years of hands-on experience and a deep passion for innovation, Neil Taylor brings a unique perspective to the table, making their blog an indispensable resource for tech enthusiasts, industry professionals, and aspiring data scientists alike. Dive into Neil Taylor’s world of expertise and embark on a journey of discovery in the realm of cutting-edge technology.