
Introduction
An e-commerce business operating across major online retail platforms struggled to make informed decisions without clear visibility into what customers actually wanted.
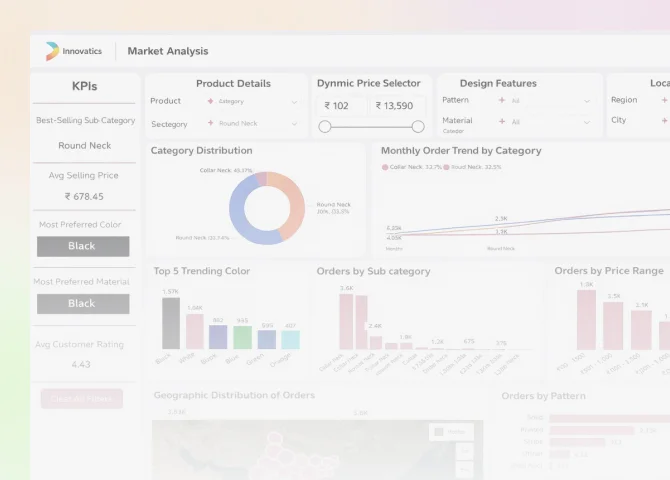
Identifying trending products, understanding regional demand, and knowing which price points and design features drove conversions were all based on assumptions rather than data. Innovatics built a market intelligence analytics dashboard powered by scraped customer review data, giving the client actionable, real-time visibility into product trends, preferences, and competitive performance.
Challenges
- Difficulty in identifying trending products across platforms in a timely and structured way
- Lack of clarity on which products to prioritize for higher revenue potential
- Limited visibility into customer preferences around color, pattern, and price
- Challenges in understanding how demand varied across different regions
- Business decisions were being made based on assumptions rather than actual data
Solution
- Scraped top 50 customer reviews per product from online portals to capture real purchase behavior data
- Extracted key data attributes including category, color, pattern, price, location, and date for structured analysis
- Cleaned and organized the raw scraped data to ensure accuracy and consistency before analysis
- Integrated the structured dataset into Power BI for interactive visualization and reporting
- Built an interactive dashboard with KPIs, trends, and category insights with dynamic filters for category, price, region, and design features
- Identified trending products and highlighted preferred colors, patterns, and materials driving the most customer engagement
- Analyzed price ranges to suggest optimal price points for maximizing sales across product categories
- Enabled side-by-side performance comparison between online portals to inform platform-specific strategy
- Surfaced regional demand patterns to support targeted marketing campaigns and production planning
Download Full case study here!
Want to talk more? Get in touch today!
Explore Unique Business Cases that We Solved
Browse All CasesSpecific Inquiry or looking for a Customized solution?
Our dedicated inquiry section ensures that your unique needs are met with precision. Join us on a journey where innovation knows no bounds. Explore Innovatics services today and chart a course towards intelligent solutions and endless possibilities.
