
Spotfinder for Real Estate Development: From Guesswork to GPS-Level Precision
Introduction
Our client operates as a premier mixed-use real estate developer with a portfolio spanning residential towers, commercial complexes, and retail destinations across multiple U.S. markets. Think high-stakes property development where a single location decision can make or break a $50 million investment.
Their development empire includes:
- Mixed-Use Communities: Integrated residential, retail, and commercial spaces that create live-work-play ecosystems.
- Regional Expansion: Strategic market entry across secondary and tertiary cities with growth potential.
- Portfolio Optimization: Simultaneous development of multiple properties requiring coordinated market analysis.
The business challenge?
Success had created a decision-making bottleneck. Every new market meant months of manual research, competitor stalking, and demographic deep-dives that moved at the speed of spreadsheets. Meanwhile, competitors were claiming prime locations while they were still crunching census data.
Our mission
Build a location intelligence platform that would transform site selection from art to science, enabling data-driven expansion decisions with machine-learning precision across demographics, competition, and market timing.
What we delivered
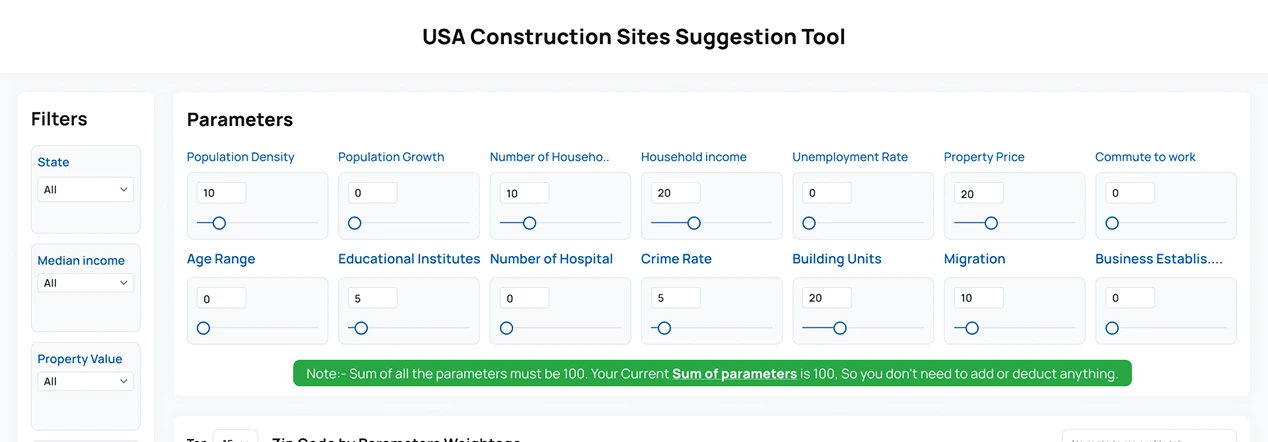
Spotfinder, a 14-parameter location intelligence engine with real-time competitive tracking, predictive market analysis, and decision-ready insights that cut site evaluation time by 80%.
Challenges
Here’s what happens when real estate expansion outpaces intelligence capabilities: you end up betting millions on gut feelings instead of data.
Competitive Blind Spots
Site evaluation took 3-6 months per location. Teams spent weeks manually collecting demographic data, mapping competitor locations, and analyzing market conditions. By the time analysis was complete, the best opportunities were gone. Think archaeological excavation when you need rapid deployment.
Competitive Blind Spots
Market data lived everywhere except where decisions were made. Demographics from census databases, competitor intel from permit filings, traffic patterns from transportation studies, and economic indicators from various government sources. No single source of truth, just data archaeology.
Competitive Blind Spots
Zero visibility into competitor development pipelines meant reactive positioning instead of strategic planning. Finding out about competitive projects through groundbreaking ceremonies isn’t market intelligence, it’s market failure.
Mixed-Use Complexity Nightmare
Balancing residential appeal, commercial viability, and retail foot traffic requirements in a single location requires analyzing overlapping customer segments, accessibility patterns, & market saturation across three different real estate categories simultaneously.
Regional Expansion Risk
Expanding into new markets without comprehensive competitive landscape analysis meant flying blind into unfamiliar territory. Local market nuances, regulatory environments, and competitive dynamics varied dramatically between regions.
Component Mix Guesswork
Determining optimal ratios of residential, commercial, and retail space relied on experience and assumptions rather than data-driven market analysis. Getting the mix wrong meant years of suboptimal performance.
Timing Intelligence Gap
No systematic approach to market entry timing meant missing optimal development windows. Understanding when to enter markets ahead of competition but after infrastructure development required predictive capabilities they didn’t have.
Scalability Bottleneck
Manual analysis processes couldn’t scale with expansion ambitions. Each new market required dedicated research teams, making rapid portfolio growth operationally impossible and cost-prohibitive.
Transformative Solution
We didn’t just build a mapping tool. We created a real estate crystal ball that thinks like a developer and performs like a machine learning algorithm.
14-Parameter Intelligence Engine
What we built:
Comprehensive location scoring algorithm analyzing demographics, competition, infrastructure, economics, and risk factors with customizable weighting for different development types.
Why it matters:
No more gut-feeling site selection. Every location gets scored against 14 data-driven criteria, eliminating subjective bias and ensuring consistent evaluation methodology across all markets.
Mixed-Use Optimization Models
What we built:
Integrated analysis balancing residential desirability, commercial accessibility, and retail foot traffic potential with component mix recommendations for optimal development ratios.
Real impact:
Data-driven decisions on whether a location should be 60% residential, 25% commercial, 15% retail, or any other combination based on actual market demand patterns, not developer intuition.
Real-Time Competitive Intelligence
What we built:
Automated competitor project tracking through permit filings, municipal announcements, and development pipeline monitoring with predictive market saturation analysis.
Translation:
Know what competitors are planning before they break ground. Identify market gaps and timing opportunities while others are still guessing about market dynamics.
Predictive Market Timing
What we built:
Machine learning algorithms analyzing development cycles, infrastructure investments, and economic indicators to identify optimal market entry windows.
Sleep better:
Enter markets at precisely the right moment. Not too early (before infrastructure), not too late (after saturation), but exactly when conditions align for maximum returns.
Interactive Decision Dashboard
What we built:
PowerBI-powered visualization platform with heat maps, competitive analysis, and scenario modeling capabilities enabling simultaneous multi-location evaluation.
Business value:
Compare 50 potential locations across 5 markets in one afternoon instead of 5 months. Filter by investment criteria, development type, or market conditions with point-and-click simplicity.
Automated Data Integration
What we built:
ETL pipelines pulling from census databases, economic indicators, transportation data, permit systems, and commercial real estate platforms with daily refresh cycles.
Bottom line impact:
Fresh market intelligence without manual data collection. Population growth, competitive projects, and economic changes update automatically, ensuring decisions use current conditions.
Risk Assessment Framework
What we built:
Multi-factor risk analysis including crime rates, environmental factors, zoning restrictions, and regulatory compliance with scenario modeling for risk mitigation.
Peace of mind:
Identify deal-breakers before investment commitments. Environmental restrictions, zoning limitations, and regulatory hurdles surface during analysis, not during development.
Scalable Geographic Coverage
What we built:
Nationwide ZIP code analysis with consistent methodology enabling rapid expansion evaluation across any U.S. market.
Revolutionary concept:
Evaluate markets in Texas using the same analytical rigor as home markets. Consistent, comparable intelligence regardless of geographic familiarity.
Implementation & Results
1. Technical Architecture That Delivers
Our Process Flow:
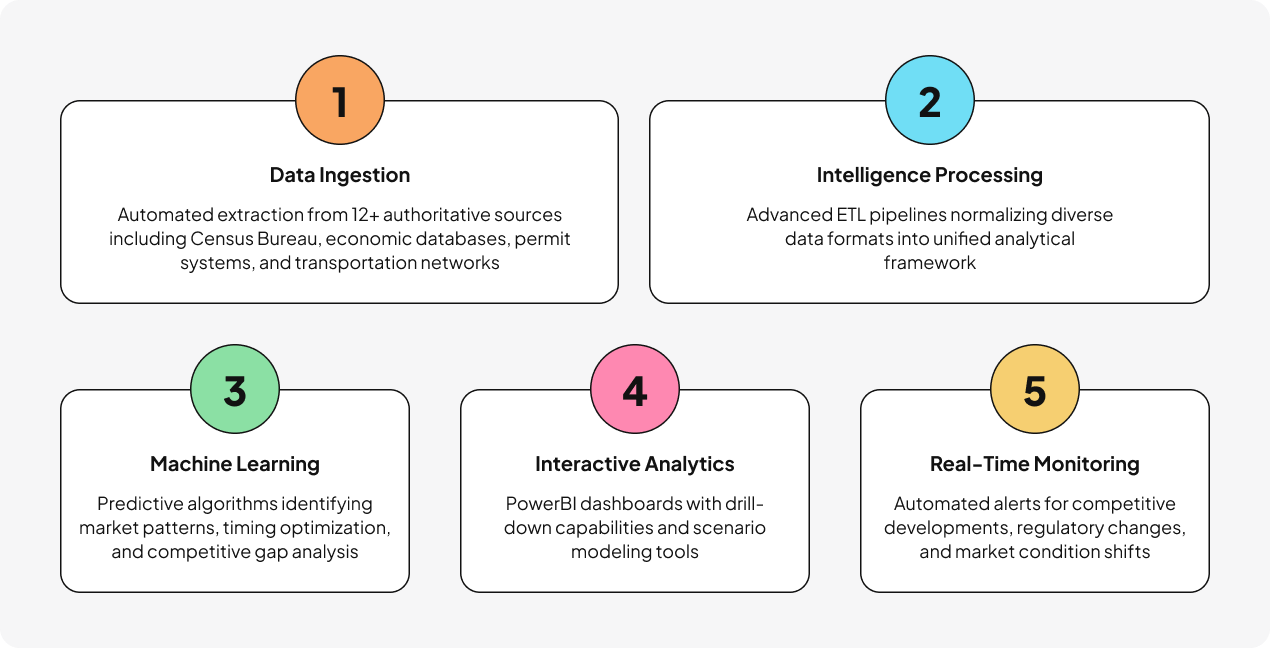
Integration Ecosystem
- Government Sources: Census Bureau, Bureau of Labor Statistics, Department of Transportation, municipal permit systems.
- Commercial Data: CoStar, LoopNet, commercial real estate platforms, economic indicators.
- Infrastructure: GIS mapping, transportation networks, utility availability, planned infrastructure investments.
Technology Stack
- Data Platform: Snowflake for analytical processing and model development.
- Visualization: PowerBI for interactive dashboards and presentation-ready reports.
- Machine Learning: Python-based algorithms for predictive modeling and pattern recognition.
- Automation: ETL pipelines ensuring daily data refresh and accuracy validation.
- Integration: API connections to authoritative data sources and real estate platforms.
2.Quantifiable Business Impact
-
80% Reduction in Market Analysis Time
Site evaluation dropped from 3-6 months to 2-3 weeks per comprehensive analysis. Teams focus on high-potential locations instead of data collection grunt work.
-
Real-Time Competitive Advantage
Automated competitor tracking provides early warning on market developments. Strategic positioning decisions based on pipeline intelligence, not public announcements.
-
Data-Driven Component Optimization
Mixed-use component ratios based on actual market demand instead of developer intuition. Optimal balance of residential, commercial, and retail space for each specific location.
-
Market Entry Timing Precision
Predictive analytics identify optimal development windows ahead of competition. Enter markets when conditions align for maximum return potential.
-
Regional Expansion Confidence
Systematic market evaluation methodology enables confident expansion into unfamiliar territories. Consistent analysis regardless of local market familiarity.
-
Cost Optimization Through Targeting
Eliminated expensive on-site evaluations for low-scoring locations. Resources focused on scientifically-validated high-potential opportunities.
-
Risk Mitigation Through Intelligence
Comprehensive analysis identifying regulatory, environmental, and competitive risks before investment commitments. Avoid expensive surprises during development.
-
Portfolio Strategy Optimization
Simultaneous multi-market analysis enabling coordinated expansion strategies. Regional portfolio development based on competitive gaps and market timing.
Conclusion & Business Value
-
We didn’t just solve a site selection problem. We built a competitive intelligence advantage.
This real estate development firm went from months-long market analysis to weeks-long decision cycles. They can now answer questions that required consulting firms before: Which markets offer the best risk-adjusted returns? How should component mix vary by location and demographics? When should they enter markets ahead of competitors but after infrastructure development?
-
The platform we built scales with ambition. New markets?
Instant analysis capability. New development types? Adjustable parameter weighting. New team members? Intuitive dashboard interface requires minimal training.
-
Most importantly, we delivered proof in production.
This isn’t a pilot project or proof-of-concept. This is a business-critical system processing real data, driving real decisions, and delivering measurable business impact every single day.
Key Success Factors:
-
Intelligence-First Design
Every feature built around actionable market insights, not data for data’s sake.
-
Predictive Capabilities
Machine learning algorithms identifying opportunities before they’re obvious to competitors.
-
Risk Integration:
Comprehensive analysis including regulatory, environmental, and competitive risk factors.
-
Scalable Architecture
Nationwide coverage enabling rapid expansion evaluation across any market.
-
Real-Time Intelligence
Automated competitive tracking and market condition monitoring.
The result? A development firm that competes on market intelligence, not just capital deployment. In an industry where location determines everything, they now have the analytical foundation to consistently identify winning sites before competitors even know they’re available.
The Spotfinder Advantage: Where data science meets real estate development, guesswork goes to die.